Thursday, February 24, 2022

Menggunakan Change Geolocation untuk Set lokasi anda koordinat di browser Google

Menggunakan Change Geolocation untuk Set lokasi anda koordinat di browser Google

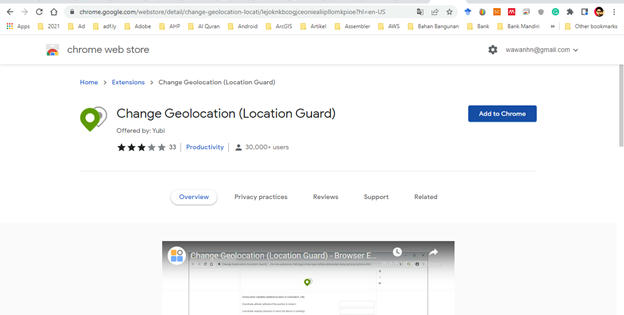
 1.       Change Gelocation (Location Guard) extension di Google Chrome:

https://chrome.google.com/webstore/detail/change-geolocation-locati/lejoknkbcogjceoniealiipllomkpioe?hl=en-US

2.    Add to Chrome   


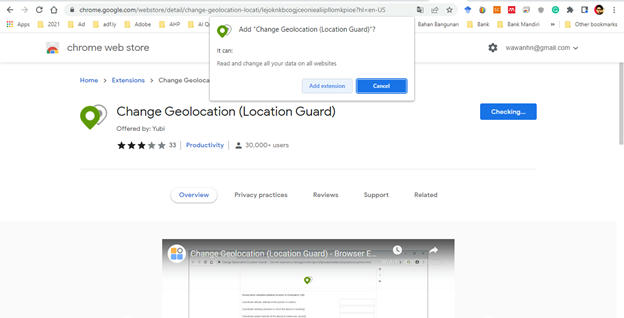
3.       Klik Add Extension toolbar


4.    Klik extension toolbar, dan klik Pin


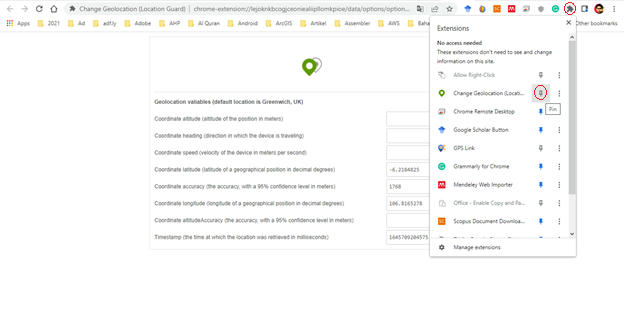
5.       Klik toolbar Geolocation Guard lalu pilih Options,


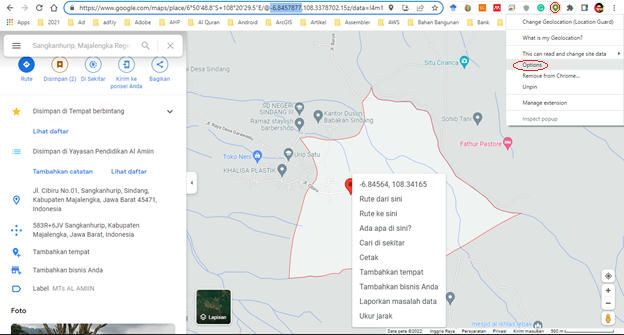
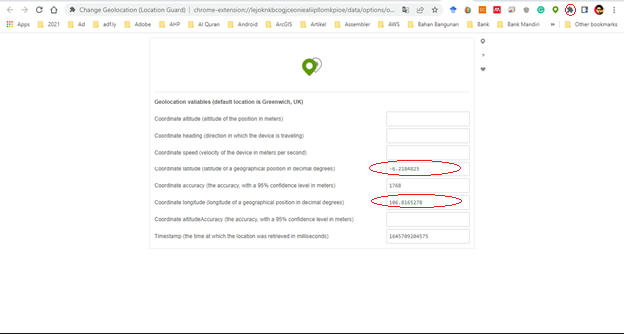
6.       Masukan nilai koordinat, misal: latitude: -6.2184825 dan longitude: 106.8165278.


7.       Silahkan coba buka https://www.google.com/maps

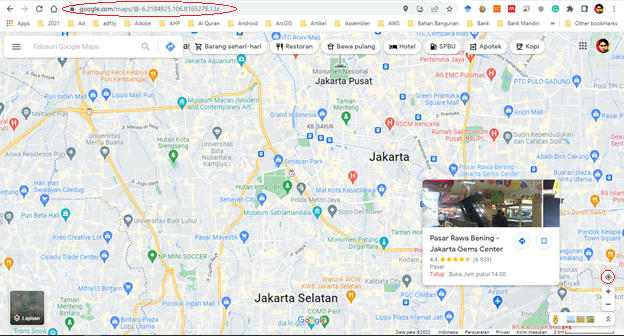
8.    Lalu pilih button lokasi anda, maka akan menampilkan lokasi koordinat yang dimasukan tadi, maka langkah Anda sudah benar.


9.       Selamat mencoba.


Wednesday, February 16, 2022

Machine Learning untuk Analisis Land Use dan Land Cover

Machine Learning untuk Analisis Land Use dan Land Cover

Materi:

  • Klasifikasi untuk analisis Land Use dan Land Cover di QGIS
  • Klasifikasi untuk analisis Land Use dan Land Cover dengan Google Earth Engine 

Software yang digunakan:

  • QGIS
  • Orfeo Toolbox
  • Google Earth Engine
Langkah-langkah:
  • Install QGIS
Sign in to Google Earth Engine
  • Sign in to Google Earth Engine, klik sign up untuk pertama kali

  • Setelah suskes sign up, selanjutnya lakukan sign in, dan coba masuk ke halaman Platform -> Code Editor

  • sd
Tambahkan Orfeo Toolbox di QGIS
  • Untuk membaca langkah-langkah download dan menambahkan Orfeo Toolbox, silahkan download ebook disini 
  • Download Orfeo Toolbox, klik https://www.orfeo-toolbox.org/download/
  • Unzip file hasil download di C, misal C:\OTB-7.0.0-Win64 dimana folder ini memuat Library Orfeo.
  • Selanjutnya download folder lain yang memuat file configurasi Orfeo Plugin di QGIS. Download zip folder di https://gitlab.orfeo-toolbox.org/orfeotoolbox/qgis-otb-plugin dan unpack it.
  • Buat folderdi drive C:\qgis-plugins\qgis-otb-plugIn and copy semua file hasil download diatas, sehingga seperti ini.

  • Selanjutnya buka QGIS, lalu pilih menu Settings -> Options. Selanjutnya pilih menu Processing -> Providers lalu pilih OTB. Set OTB application folder dengan C:\OTB-7.4.0-Win64\lib\otb\applications dan OTB folder dengan C:\OTB-7.4.0-Win64 lalu klik OK.
  • Maka Orfeo Toolbox siap digunakan di QGIS.
Analisis supervised dengan Orfeo Toolbox  di QGIS, tahapan yang akan dilakukan adalah:
  • Melakukan analisis Unsupervise (K-means) dengan OTB di QGIS.
  • Menggunakan Random Forest, SVM, dan Decission Tree di QGIS.
  • Melakukan performasi assesment akurasi dan compute main accuracy measures.
Analysis di GEE:
  • Import dan visualisasi Sentinel image di GEE
//import the satellite data from european space agency
var S2 = ee.ImageCollection("COPERNICUS/S2");


//filter for Dubai
S2 = S2.filterBounds(Dubai);
print(S2);

//filter date
S2 = S2.filterDate("2020-01-01","2020-05-11");
print(S2);

//visualize image
var image = ee.Image(S2.first());
Map.addLayer(image, {min:0, max:3000,bands:"B4,B3,B2"}, "DubaiTrue Color");

Map.addLayer(image, {min:0, max:3000,bands:"B8,B4,B3"}, "Dubai False Color");


  • Import dan Visualisasi Citra Landsat 8 di GEE
//import the satellite data from european space agency
var L8 = ee.ImageCollection("LANDSAT/LC08/C01/T1_TOA");

var spatialFiltered =L8.filterBounds(Cirebon);
print('spatialFiltered', spatialFiltered);

var temporalFiltered = spatialFiltered.filterDate('2015-01-01', '2015-12-31');
print('temporalFiltered', temporalFiltered);

// This will sort from least to most cloudy.
var sorted = temporalFiltered.sort('CLOUD_COVER');

// Get the first (least cloudy) image.
var scene = sorted.first();

Map.centerObject(scene, 9);
Map.addLayer(scene, {}, 'default RGB');

var visParams = {bands: ['B4', 'B3', 'B2'], max: 0.3};
Map.addLayer(scene, visParams, 'true-color composite');

//Create training dataset
var training = scene.sample(
  { region : Cirebon,
    scale : 20,
    numPixels : 5000
  }
  );
  
//Start Unsupervised clustering algorithm and training it
var kmeans = ee.Clusterer.wekaKMeans(3).train(training);

//Cluster the input using the trained clusterer.
var result = scene.cluster(kmeans);

//Display the cluster with random colors
Map.addLayer(result.randomVisualizer(),{}, "Unsupervised kmeans classification");

//Export the Image to Drive
Export.image.toDrive({
  image :result,
  description : 'kmeans Cirebon',
  scale : 20,
  region : Cirebon
  });


  • Unsupervised analysis di GEE
//import the satellite data from european space agency
var S2 = ee.ImageCollection("COPERNICUS/S2");


//filter for Dubai
S2 = S2.filterBounds(Dubai);
print(S2);

//filter date
S2 = S2.filterDate("2020-01-01","2020-05-11");
print(S2);

//visualize image
var image = ee.Image(S2.first());
//Map.addLayer(image, {min:0, max:3000,bands:"B4,B3,B2"}, "DubaiTrue Color");

Map.addLayer(image, {min:0, max:3000,bands:"B8,B4,B3"}, "Dubai False Color");

//Create training dataset
var training =image.sample(
  { region : Dubai,
    scale : 20,
    numPixels : 5000
  }
  );
  
//Start Unsupervised clustering algorithm and training it
var kmeans = ee.Clusterer.wekaKMeans(5).train(training);

//Cluster the input using the trained clusterer.
var result = image.cluster(kmeans);

//Display the cluster with random colors
Map.addLayer(result.randomVisualizer(),{}, "Unsupervised kmeans classification");

//Export the Image to Drive
Export.image.toDrive({
  image :result,
  description : 'kmenas Dubai',
  scale : 20,
  region : Dubai
  });


  • Supervised analysis di GEE